데이터 다루기/데이터 시각화
[R을 활용한 시각화] 7. ggplot2 (Histogram)
분석벌레
2020. 12. 10. 01:37
728x90
이번 포스팅에서는 ggplot2 패키지를 활용해서 다양한 Histogram을 그려보도록 하겠습니다.
1. 실습 데이터 정의
# Convert cyl column from a numeric to a factor variable
set.seed(1234)
df <- data.frame(
  sex=factor(rep(c("F", "M"), each=200)),
  weight=round(c(rnorm(200, mean=55, sd=5),
                 rnorm(200, mean=65, sd=5)))
  )
head(df)

<< Result >>
  sex weight
1   F     49
2   F     56
3   F     60
4   F     43
5   F     57
6   F     58
이번에 사용할 데이터는 성별 별로, 각각 남성은 평균이 55, 표준편차가 5인 정규분포에서, 그리고 여성은 평균이 65, 표준편자차 5인 정규분포에서 200개씩 샘플링해서 뽑았습니다.
2. 패키지 불러오기
library(ggplot2)library 함수를 통해 먼저 ggplot2 패키지를 불러왔습니다.
3. Histogram 꾸미기
# Basic histogram
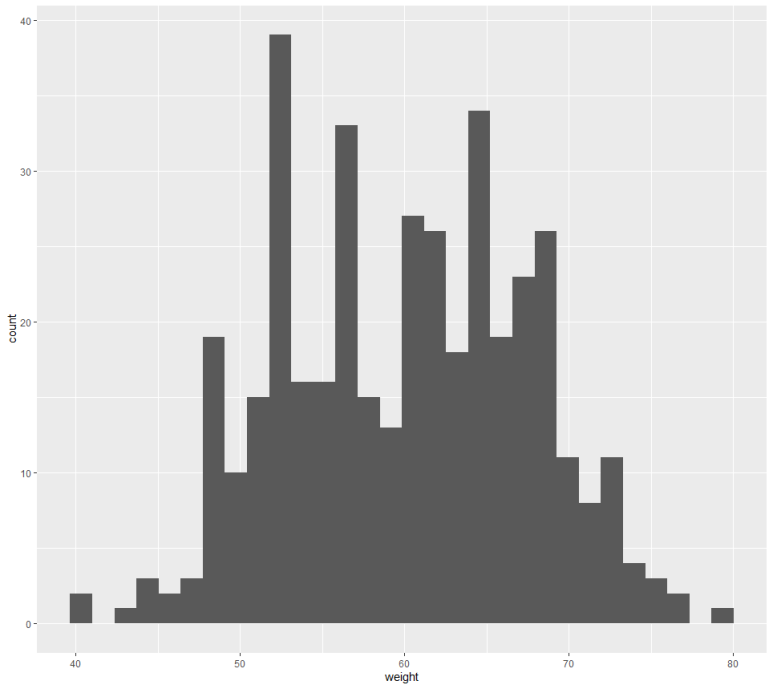
ggplot(df, aes(x=weight)) + geom_histogram()

Histogram은 geom_histogram 함수를 통해 그릴 수 있습니다.
(1) Bandwidth
# Change the width of bins
ggplot(df, aes(x=weight)) +
  geom_histogram(binwidth=5)
Histogram을 그릴 때, 가장 중요한 정보는 x축의 범위입니다.
binwidth 인자로 histogram의 bin을 설정할 수 있습니다.
(2) Histogram color
# Change colors
p<-ggplot(df, aes(x=weight)) +
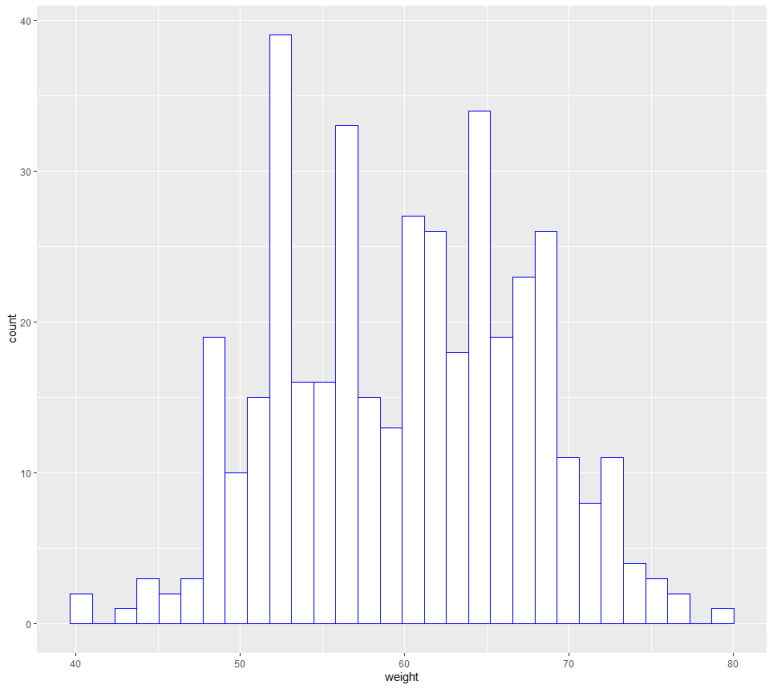
  geom_histogram(color="blue", fill="white")
p

color 인자로 histogram의 테두리의 색깔을, fill 인자로 histogram 내부의 색깔을 설정할 수 있습니다.
(3) Histogram with density plot
# Histogram with density plot
ggplot(df, aes(x=weight)) +
  geom_histogram(aes(y=..density..), colour="black", fill="white")+
  geom_density(alpha=.2, fill="#FF6666")

geom_density 함수를 사용하면, Histogram과 density plot을 같이 그릴 수 있습니다.
alpha는 density plot의 투명도를 조절합니다.