728x90
반응형
from sklearn.datasets import load_iris
import pandas as pd
iris = load_iris()
data = pd.DataFrame(data=iris.data, columns=iris.feature_names)
data['target'] = iris.target
data['target'] = data['target'].map({0:"setosa", 1:"versicolor", 2:"virginica"})
data.head()
실습 데이터는 Scikit-learn에서 제공하는 Iris 데이터입니다.
(1) 단순 Scatter plot 그리기
import matplotlib.pyplot as plt
plt.figure(figsize=(12,8))
plt.scatter(data['sepal length (cm)'],data['petal length (cm)'])
plt.show()
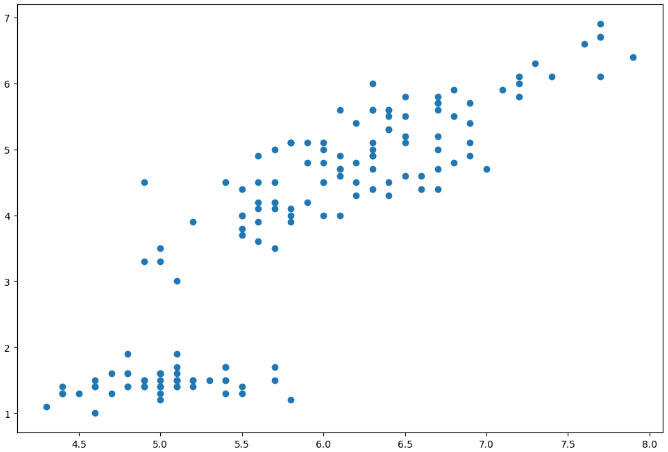
단순히 그린 경우에 X축과 Y축 ticks의 사이즈가 작아 잘 안보이고, 또한 각 축이 의미하는 바가 적혀있지 않아 그래프를 해석하기 쉽지 않아보입니다.
(2) X축과 Y축 Label 및 ticks 사이즈 조절
plt.figure(figsize=(12,8))
plt.scatter(data['sepal length (cm)'],data['petal length (cm)'])
plt.title('Sepal Length vs Petal Length', fontsize=25)
plt.xlabel('Sepal Length', fontsize=20)
plt.ylabel('Petal Length', fontsize=20)
plt.xticks(fontsize=14)
plt.yticks(fontsize=14)
plt.show()
확실히 초기 그림에서 Label과 Font size가 조절되어, 시각적으로 업그레이드 되었습니다.
(3) Scatter Color 조절
colors = {'setosa':'red', 'versicolor':'green', 'virginica':'blue'}

plt.figure(figsize=(12,8))
plt.scatter(data['sepal length (cm)'],data['petal length (cm)'], c = data['target'].map(colors))
plt.title('Sepal Length vs Petal Length', fontsize=25)
plt.xlabel('Sepal Length', fontsize=20)
plt.ylabel('Petal Length', fontsize=20)
plt.xticks(fontsize=14)
plt.yticks(fontsize=14)
plt.show()
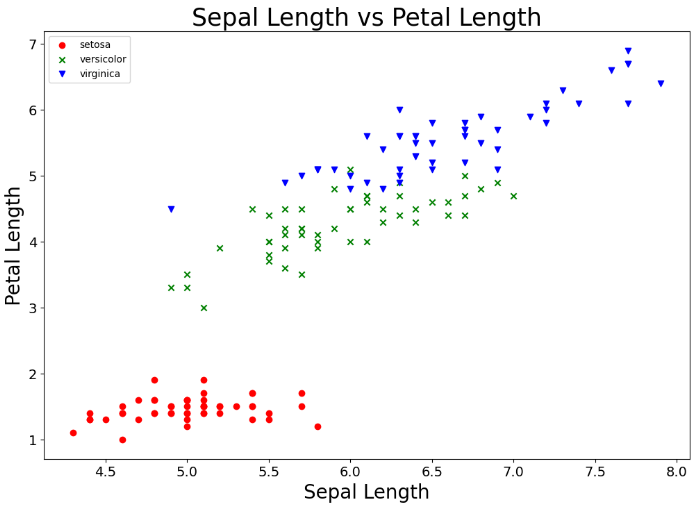
(4) Scatter Style 및 Size 조절
setosa = data[data['target'] =='setosa']
versicolor = data[data['target'] =='versicolor']
virginica = data[data['target'] =='virginica']

plt.figure(figsize=(12,8))
setosa_sc = plt.scatter(setosa['sepal length (cm)'],setosa['petal length (cm)'], marker='o', color='r')
versicolor_sc = plt.scatter(versicolor['sepal length (cm)'],versicolor['petal length (cm)'], marker='x', color='g')
virginica_sc = plt.scatter(virginica['sepal length (cm)'],virginica['petal length (cm)'], marker='v', color='b')
plt.legend((setosa_sc,versicolor_sc,virginica_sc), ('setosa','versicolor','virginica'),loc='upper left')
plt.title('Sepal Length vs Petal Length', fontsize=25)
plt.xlabel('Sepal Length', fontsize=20)
plt.ylabel('Petal Length', fontsize=20)
plt.xticks(fontsize=14)
plt.yticks(fontsize=14)
plt.show()
반응형