728x90
1. Principal Component Analysis (PCA)
# PCA
# age credit_amount duration_in_month installment_rate num_of_existing_credits num_of_people_liable present_residence
german <- read.csv('German_credit.csv')
german_1 <- german[, c(3,6,9,12,14,17,19)]
summary(german_1)


 Duration_in_month Credit_amount   Installment_rate Present_residence      Age
 Min.   : 4.0      Min.   :  250   Min.   :1.000    Min.   :1.000     Min.   :19.00
 1st Qu.:12.0      1st Qu.: 1366   1st Qu.:2.000    1st Qu.:2.000     1st Qu.:27.00
 Median :18.0      Median : 2320   Median :3.000    Median :3.000     Median :33.00
 Mean   :20.9      Mean   : 3271   Mean   :2.973    Mean   :2.845     Mean   :35.55
 3rd Qu.:24.0      3rd Qu.: 3972   3rd Qu.:4.000    3rd Qu.:4.000     3rd Qu.:42.00
 Max.   :72.0      Max.   :18424   Max.   :4.000    Max.   :4.000     Max.   :75.00
 Num_of_existing_credits Num_of_people_liable
 Min.   :1.000           Min.   :1.000
 1st Qu.:1.000           1st Qu.:1.000
 Median :1.000           Median :1.000
 Mean   :1.407           Mean   :1.155
 3rd Qu.:2.000           3rd Qu.:1.000
 Max.   :4.000           Max.   :2.000
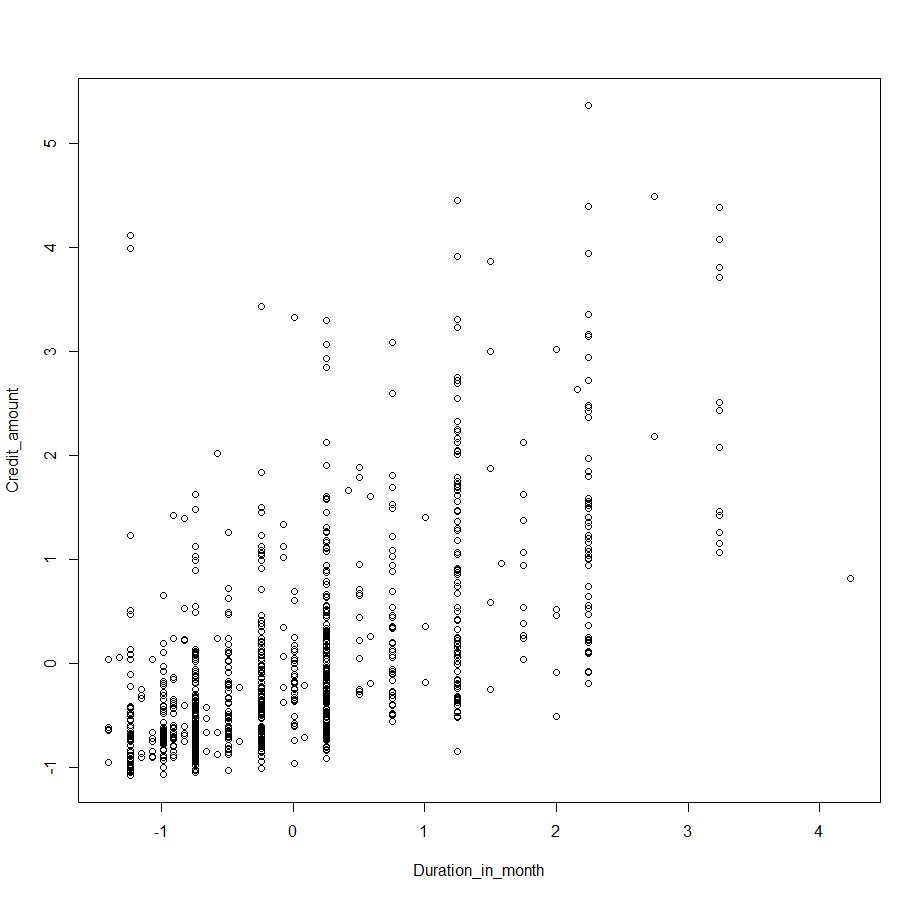
german_scaled <- scale(german_1, center = TRUE, scale = TRUE)
plot(german_scaled)

scale 함수를 통해서, 데이터를 정규화 시킬 수 있습니다.
dat_cov = cov(german_scaled)
dat_cor = cor(german_scaled)
PCA는 데이터의 공분산 행렬이나, 상관계수 행렬을 필요로 합니다.
pca_cov <- prcomp(german_scaled, covmat=dat_cov) # cov # stdev2 = lambda
pca_cor <- prcomp(german_scaled, covmat=dat_cor) # corr # stdev2 = lambda
PCA는 R에서 prcomp 함수를 통해서 모델링 가능합니다.
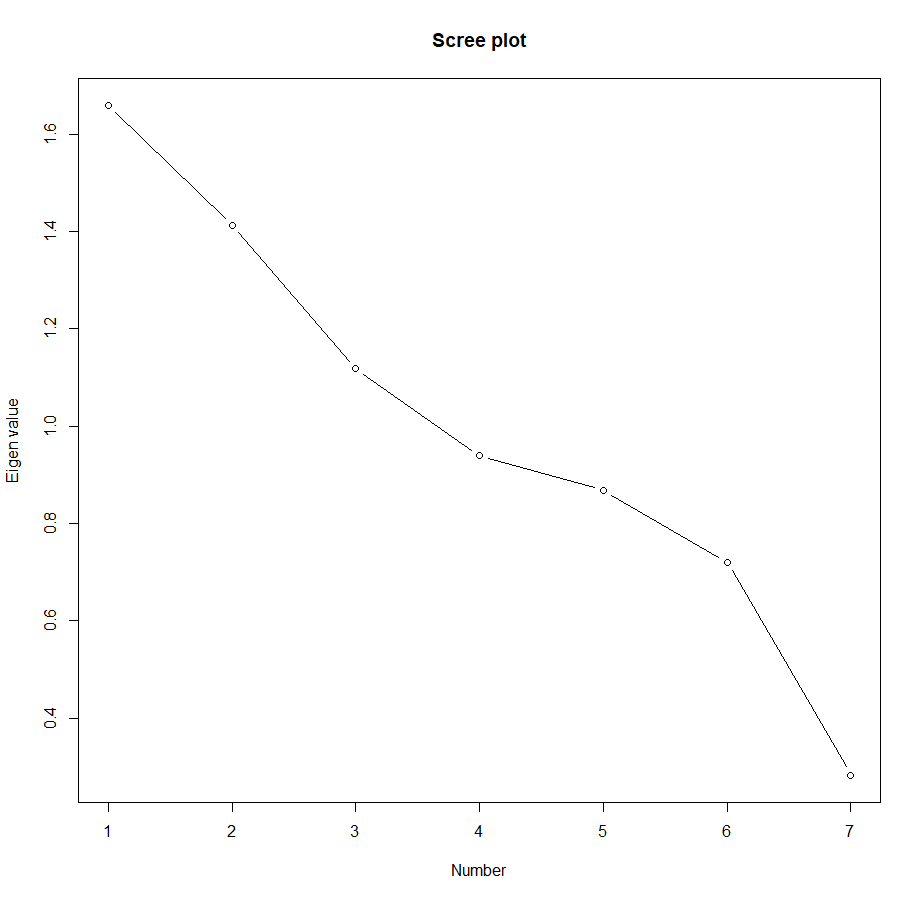
eigenv <- pca_cor$sdev^2
x <- seq(1:ncol(german_scaled)) # x축
plot(x, eigenv, main="Scree plot", type="b", xlab="Number", ylab="Eigen value")

PC 들의 표준편차를 불러와서, 제곱해주면 Eigenvalue 를 구할 수 있고, 선택되는 PC의 순번에 따라 Eigenvalue의 변화를 관찰합니다.
plot(pca_cor, type="lines")
위의 코드로 한 번에 위의 plot을 그릴 수도 있습니다.
biplot(pca_cor)
biplot 함수는 PC1과 PC2에 대한 Score plot을 그려줍니다.
summary(pca_cor)

Importance of components:
                         PC1    PC2    PC3    PC4    PC5    PC6     PC7
Standard deviation     1.288 1.1885 1.0574 0.9691 0.9318 0.8489 0.53148
Proportion of Variance 0.237 0.2018 0.1597 0.1342 0.1240 0.1029 0.04035
Cumulative Proportion  0.237 0.4388 0.5985 0.7327 0.8567 0.9597 1.00000
summary 함수는 PC들의 분산에 대한 누적 비율을 한 눈에 보여줍니다.
2. Factor Analysis
fa_g <- factanal(german_scaled, factors=3, rotation="varimax", scores = "regression") # varimax is the default
Factor analysis 는 factanal 함수를 사용하여, 모델링 할 수 있습니다.
load <- fa_g$loadings
load

Loadings:
                        Factor1 Factor2 Factor3
Duration_in_month        0.985   0.152
Credit_amount            0.672  -0.223
Installment_rate                 0.994
Present_residence                        0.379
Age                                      0.685
Num_of_existing_credits                  0.235
Num_of_people_liable                     0.182

               Factor1 Factor2 Factor3
SS loadings      1.430   1.071   0.708
Proportion Var   0.204   0.153   0.101
Cumulative Var   0.204   0.357   0.458
결과를 loading attribute에서 뽑아낼 수 있습니다.
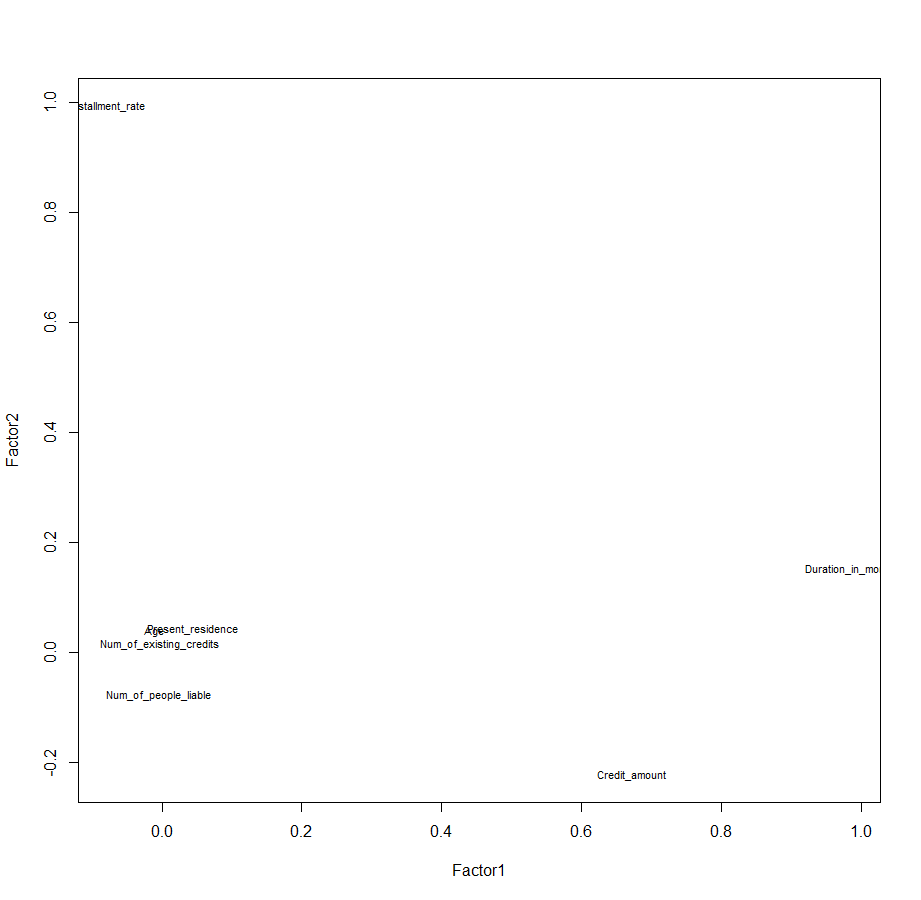
plot(load[,1:2],type="n") # plot factor 1 by 2
text(load[,1:2],labels=colnames(german_scaled),cex=.7) # add variable names

각 변수들을 factor 1 과 factor 2에 대해 표현할 수 있습니다.
Duration_in_month 와 Credit_amount는 Factor 1과 큰 관련이 있네요.
'데이터 다루기 > Base of R' 카테고리의 다른 글
| [R] K-nearest neighbor (KNN) method (0) | 2020.04.07 |
|---|---|
| [R] Hierarchical clustering, K-means clustering (0) | 2020.03.16 |
| [R] Ridge, Lasso, ElasticNet Regression (1) | 2020.03.09 |
| [R] Data Partition (데이터 분할) (0) | 2020.03.09 |
| [R] 회귀 분석 (변수선택) (0) | 2020.03.08 |

