728x90
저희가 사용할 데이터는 german credit 데이터로, 7가지 변수를 사용하도록 하겠습니다.
#데이터 불러오기
german<-read.csv("German_credit.csv")

# age credit_amount duration_in_month installment_rate num_of_existing_credits num_of_people_liable present_residence
german_1 <- german[, c(3,6,9,12,14,17,19)]
7가지 변수를 그대로, clustering 하는 것이 아니라, 지난 포스팅에서 배운 Factor analysis를 사용해, 3개의 factor로 데이터를 요약한 후, 진행해보도록 하겠습니다.
# FA
fa_g <- factanal(german_1, factors=3, rotation="varimax", scores = "regression") # varimax is the default

# Clustering
german_2 <- fa_g$scores

d <- dist(german_2, method="euclidean")
# distance matrix
# method="euclidean", "maximum", "manhattan", "canberra", "binary", "minkowski"
각 변수마다 distance를 정의해야 하는데, 가장 기본적인 것이 유클리디안 거리입니다.
이외에도 맨하탄, 캔버라, 민코우스키 등 다양한 거리가 있습니다.
C1 <- hclust(d, method="ward.D2")
# method="ward.D2", "single", "complete", "average","centroid"

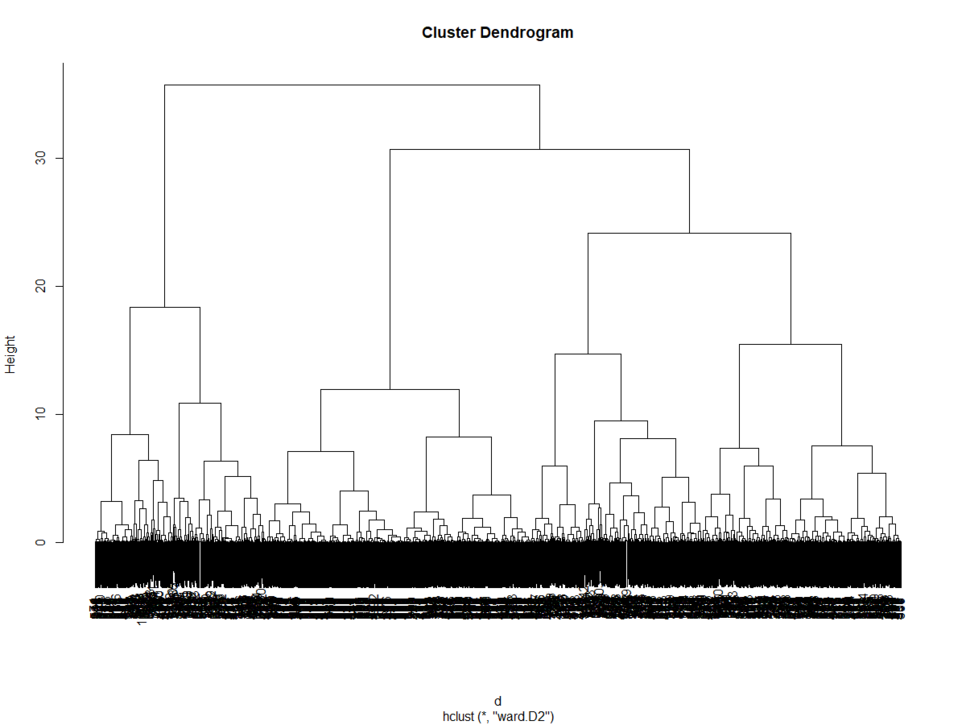
plot(C1) # display dendogram
계층적 클러스터링에는 여러가지 방법이 있는데, 저희는 ward 계층적 클러스터링을 선택하였습니다.

1000개의 관측치가, 계층적으로 구성됩니다.
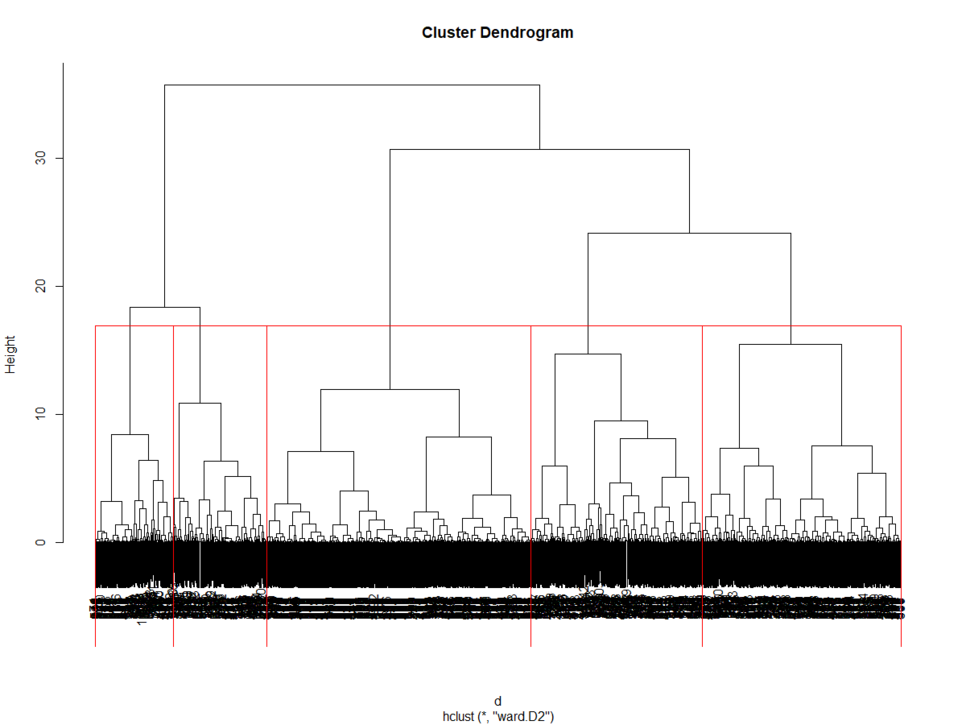
C1_groups <- cutree(C1, k=5) # cut tree into 3 clusters
rect.hclust(C1, k=5, border="red")
5개의 그룹으로 나누었습니다.

german_3 <- cbind(german_2, C1_groups) #cluster와 원데이터 통합

#군집별 평균 구하기
german_3<-as.data.frame(german_3) #german_3가 행렬형태라 list의 조합인 데이터프레임으로 바꿔줘야함.
install.packages('dplyr')
library(dplyr)
german_3[,4]<-as.data.frame(german_3[,4])
german_3%>%group_by(C1_groups)%>%summarise(mean_Factor1=mean(Factor1),mean_Factor2=mean(Factor2),mean_Factor3=mean(Factor3)) #각 군집별 평균

# A tibble: 5 x 4
  C1_groups mean_Factor1 mean_Factor2 mean_Factor3
      <dbl>        <dbl>        <dbl>        <dbl>
1         1       -0.372       -0.127       0.930
2         2        1.39        -0.832      -0.273
3         3       -0.421       -1.03       -0.385
4         4       -0.436        0.891      -0.223
5         5        1.69         0.902       0.0180
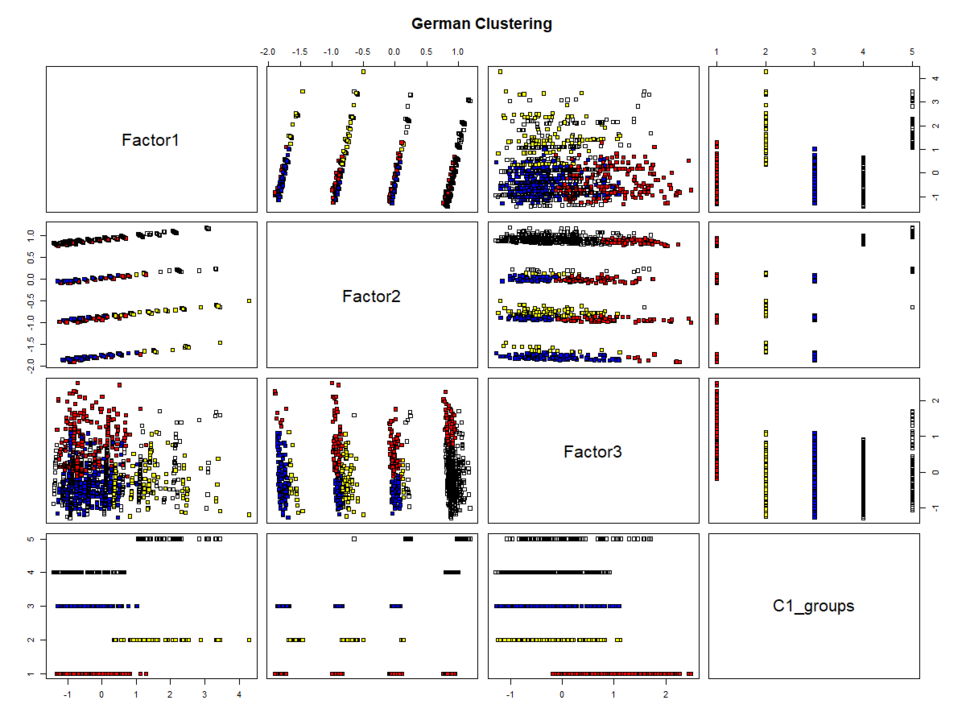
또한 각 군집별로 평균을 구할 수 있습니다.
pairs(german_3, main="German Clustering", pch=22, bg=c("red", "yellow", "blue")[unclass(german_3$C1_groups)])

#K-means 방법- PC를 구해서, randomly select centroids, 하나씩 추가
install.packages('cluster')
library(cluster)

german_3 = german_3[,-4]
C2 <- kmeans(german_3, 5)
C2$cluster
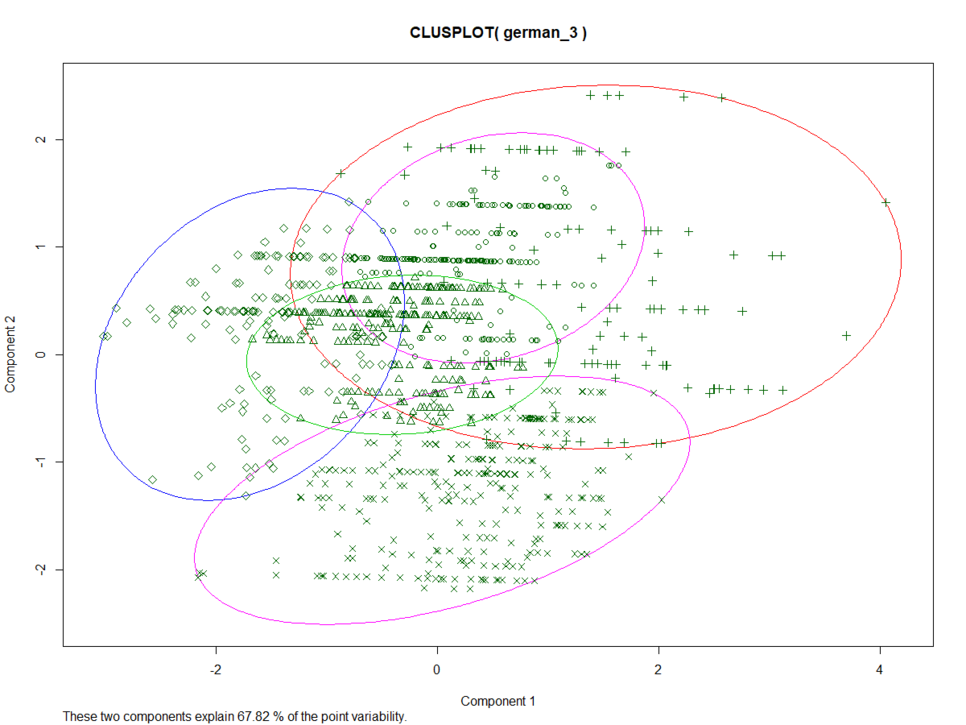
clusplot(german_3, C2$cluster, color=TRUE, lines=0)
kmeans 함수를 통해, 5개의 클러스터를 만들었습니다.
clusplot 함수는 각 클러스터들의 PCA를 통해 만든 2개의 PC로 그려줍니다.

'데이터 다루기 > Base of R' 카테고리의 다른 글
| [R] Logistic Regression (0) | 2020.04.07 |
|---|---|
| [R] K-nearest neighbor (KNN) method (0) | 2020.04.07 |
| [R] Principal Component Analysis (PCA), Factor Analysis (0) | 2020.03.11 |
| [R] Ridge, Lasso, ElasticNet Regression (1) | 2020.03.09 |
| [R] Data Partition (데이터 분할) (0) | 2020.03.09 |


