728x90
반응형
안녕하세요.
이번 포스팅에서는 Python을 활용한 막대 그래프 (Bar plot)을 그려보도록 하겠습니다.
우선 numpy와 matplotlib 패키지를 불러오도록 하겠습니다.
import numpy as np
import matplotlib.pyplot as plt
간단한 막대 그래프를 그려보기 위해서 데이터를 생성하도록 하겠습니다.
height = [3, 12, 5, 18, 45]
bars = ('A', 'B', 'C', 'D', 'E')
이제 x축에 A B C D E 와 함께 y축에 height를 가지를 막대 그래프를 그려보겠습니다.
x_pos = np.arange(len(bars))

# Create horizontal bars
plt.bar(x_pos, height)

# Create names on the x-axis
plt.xticks(x_pos, bars)

# Show graphic
plt.show()
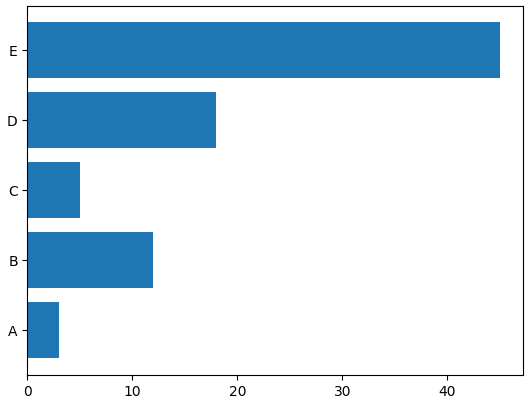
hbar를 사용함으로써, 옆으로 누운 막대 그래프를 그릴 수 있습니다.
y_pos = np.arange(len(bars))

# Create horizontal bars
plt.barh(y_pos, height)

# Create names on the x-axis
plt.yticks(y_pos, bars)

# Show graphic
plt.show()
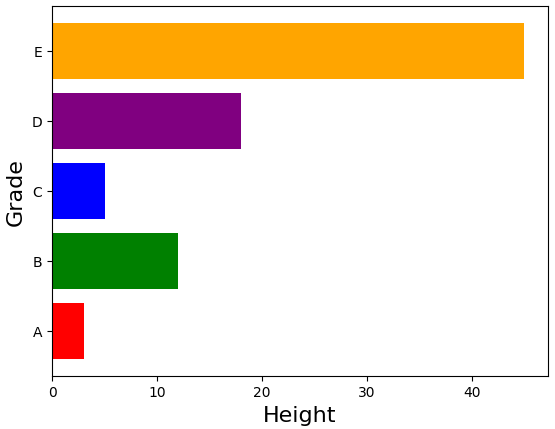
한 번 막대그래프를 꾸며보도록 하겠습니다.
color 인자에 색상을 지정할 수 있고, x축과 y축의 label을 정해줄 수 있습니다.
y_pos = np.arange(len(bars))

# Create horizontal bars
plt.barh(y_pos, height, color = ['red', 'green', 'blue', 'purple', 'orange'])

# Create names on the x-axis
plt.yticks(y_pos, bars)

# Name axis labels
plt.xlabel('Height', size = 16)
plt.ylabel('Grade', size = 16)

# Show graphic
plt.show()
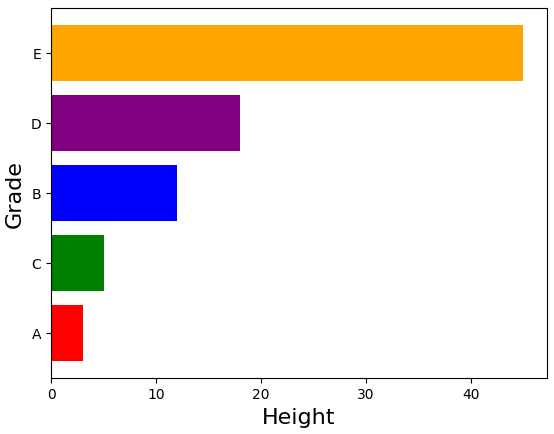
이번에는 크기 순서대로 정렬을 해보도록 하겠습니다.
정렬하기 위해서는 Dataframe 형식으로 변형한 다음에, sort_values 함수를 사용합니다.
import pandas as pd
data = pd.DataFrame({'height': height, 'bars': bars})
data = data.sort_values(by = 'height')

y_pos = np.arange(len(data['bars']))

# Create horizontal bars
plt.barh(y_pos, data['height'], color = ['red', 'green', 'blue', 'purple', 'orange'])

# Create names on the x-axis
plt.yticks(y_pos, data['bars'])

# Name axis labels
plt.xlabel('Height', size = 16)
plt.ylabel('Grade', size = 16)

# Show graphic
plt.show()
반응형
'데이터 다루기 > 데이터 시각화' 카테고리의 다른 글
| [Python 시각화] Pie Chart (파이 차트) (0) | 2022.12.19 |
|---|---|
| [Python 시각화] Bar plot (2) (0) | 2022.12.19 |
| [Python 시각화] Scatter plot (2) (0) | 2022.12.07 |
| [Python 시각화] Scatter plot (점 그래프) (0) | 2022.12.05 |
| [R을 활용한 시각화] 9. ggplot2 (ECDF: 경험적 누적 밀도 함수) (0) | 2020.12.11 |


