이번 포스팅에서는 ggplot2 패키지를 활용해서 다양한 Barplot을 그려보도록 하겠습니다.
1. 실습 데이터 정의
df <- data.frame(Name = c("JW", "HJ", "SY"), Weight = c(57, 80, 42))
head(df)

<< Result >>
	Name Weight
   1 JW 57
   2 HJ 80
   3 SY 42
우선 단순한 데이터를 정의 하였습니다.
2. 패키지 불러오기
library(ggplot2)library 함수를 통해 먼저 ggplot2 패키지를 불러왔습니다.
3. Bargraph 꾸미기
# Basic barplot
p<-ggplot(data=df, aes(x=Name, y=Weight)) + geom_bar(stat="identity")
p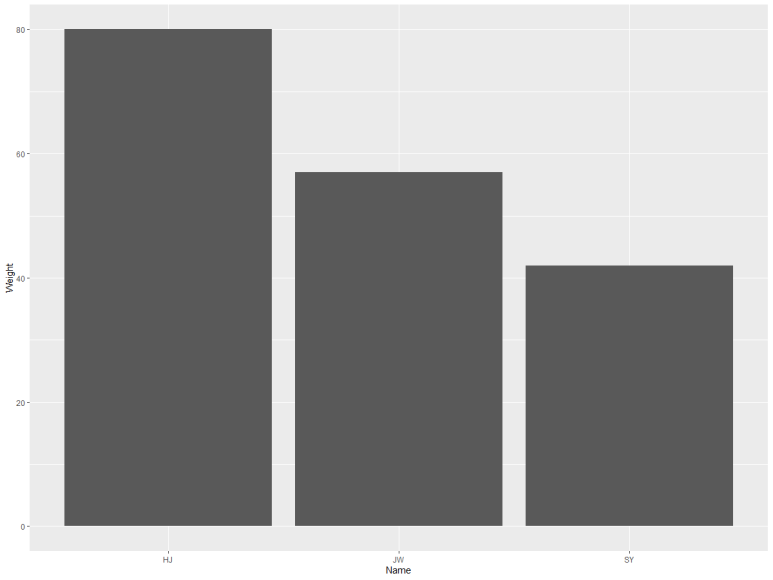
먼저 아주 단순한 Barplot을 그려보았습니다.
여기서 stat은 Barplot을 그리는 통계값을 말하며, 이 데이터의 경우 고유 값이 크기를 나타내므로 "identity"를 사용합니다. 만약에 y 값이 A, B, C 처럼 범주이고, 데이터에 A가 3개, B가 4개, C가 2개를 Barplot으로 그리고자 할 때, "count"로 바꿔주면 됩니다.
(1) 회전
# Horizontal bar plot
p + coord_flip()
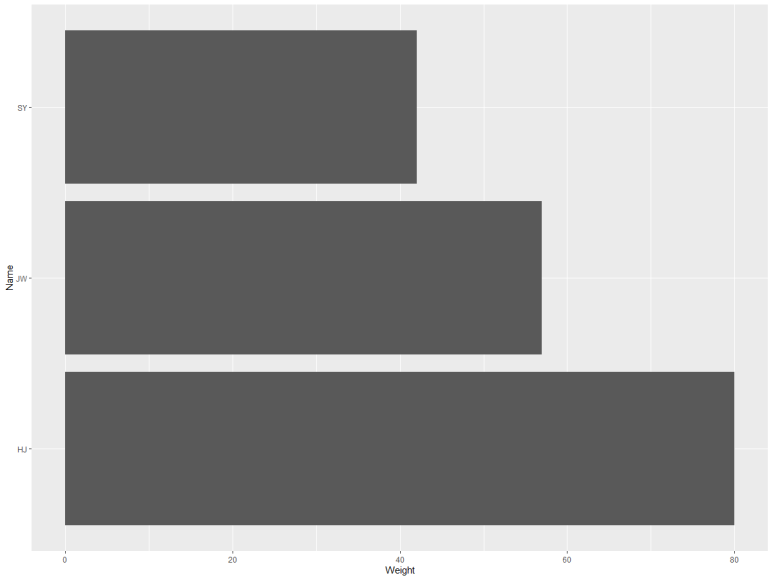
coord_flip 함수를 통해 Barplot을 옆으로 눕힐수도 있습니다.
전체적으로 볼때, Visual 측면에서 별로네요...
한번 업그레이드 해보도록 하겠습니다.
(2) 두께 조절
# Change the width of bars
ggplot(data=df, aes(x=Name, y=Weight)) + geom_bar(stat="identity", width=0.5)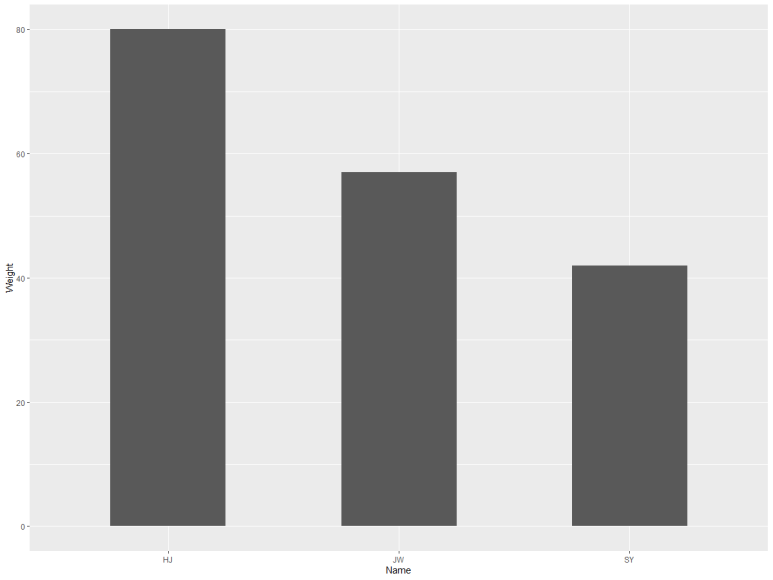
우선 width 옵션을 통해서, Bargraph의 크기를 조절할 수 있습니다.
(3) 색상 입히기
# Minimal theme + blue fill color
p<-ggplot(data=df, aes(x=Name, y=Weight)) + geom_bar(stat="identity", width=0.5, fill="steelblue")+ theme_minimal()
p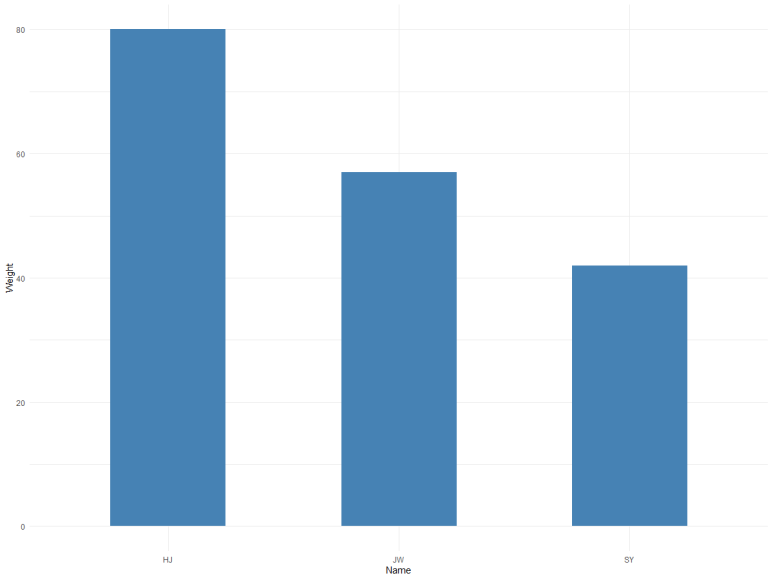
추가적으로 fill 옵션을 통해, bargraph의 색깔을 변경할 수 있고, theme_minimal 함수를 통해 배경을 최소화 시킬 수 있어요.
(4) Bar 위치 조정
# x order change
p + scale_x_discrete(limits=c("JW", "HJ", "SY"))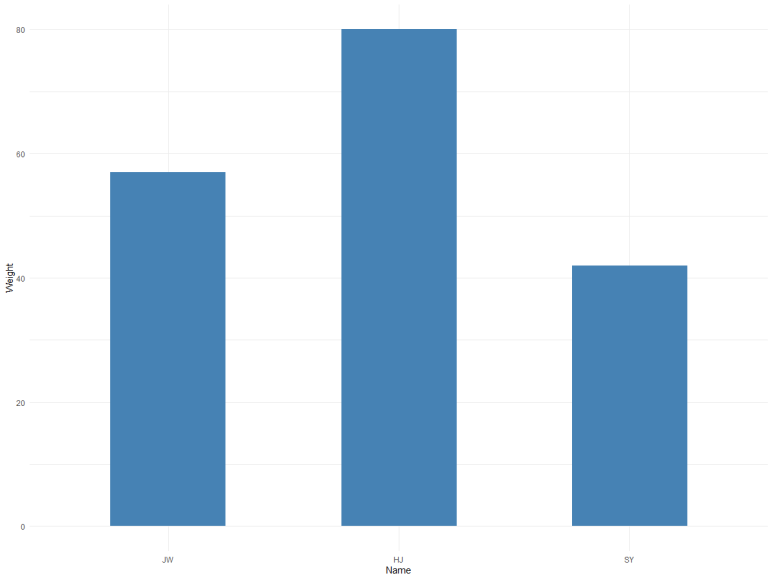
그리고 위에 그래프를 보시면, 맨 처음 데이터의 순서와는 다르게 크기 순서대로 정렬이 되있죠??
이를 원하는 순서대로 바꾸기 위해서, scale_x_discrete 함수를 사용하였습니다.
(5) 값 라벨링
# Outside bars
ggplot(data=df, aes(x=Name, y=Weight)) + geom_bar(stat="identity", fill="steelblue")+ geom_text(aes(label=Weight), vjust=-0.8, size=3.5)+ theme_minimal()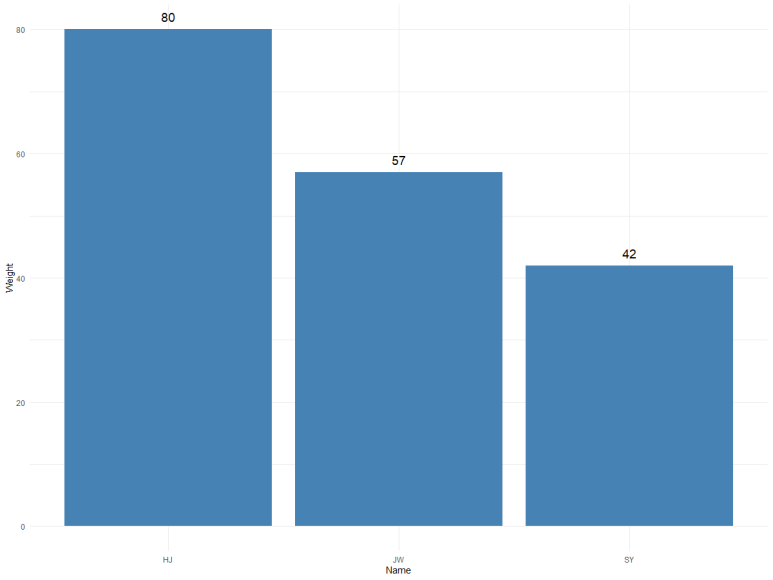
Bargraph 위쪽에 Weight 값을 labeling할 수 있습니다.
이 때, vjust > 0 이면 Bargraph 안쪽에 label을 맵핑할 수 있습니다.
# Inside bars
ggplot(data=df, aes(x=Name, y=Weight)) + geom_bar(stat="identity", fill="steelblue")+ geom_text(aes(label=Weight), vjust=1.6, color="white", size=8)+ theme_minimal()
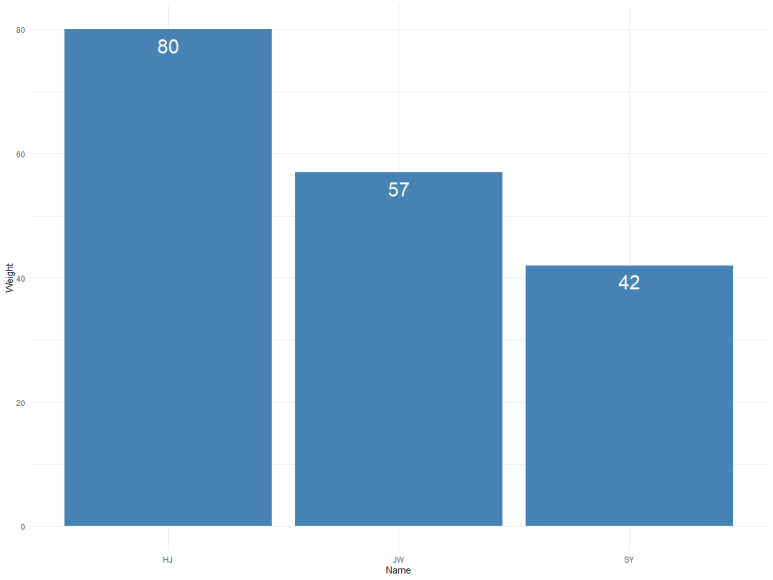
이렇게 vjust를 조절해서 Weight를 Bar 안쪽에 집어넣을수도 있습니다.
(6) 색깔을 마음대로
# Change barplot fill colors by groups
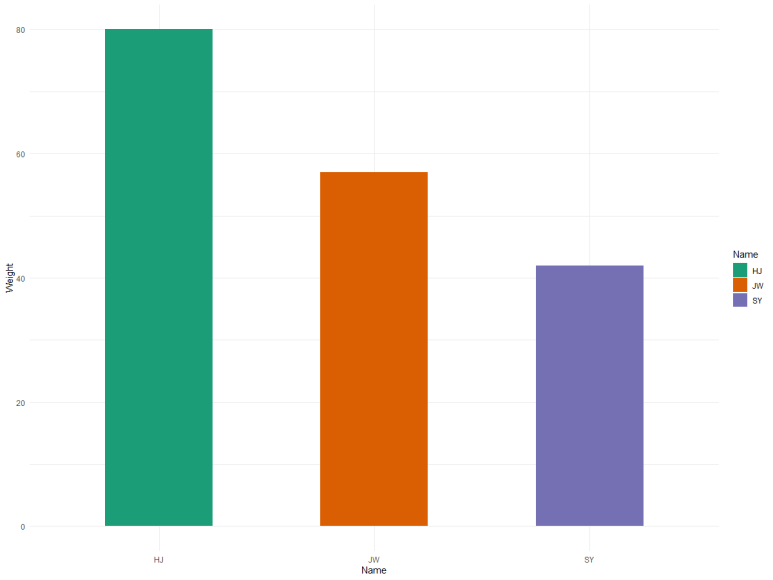
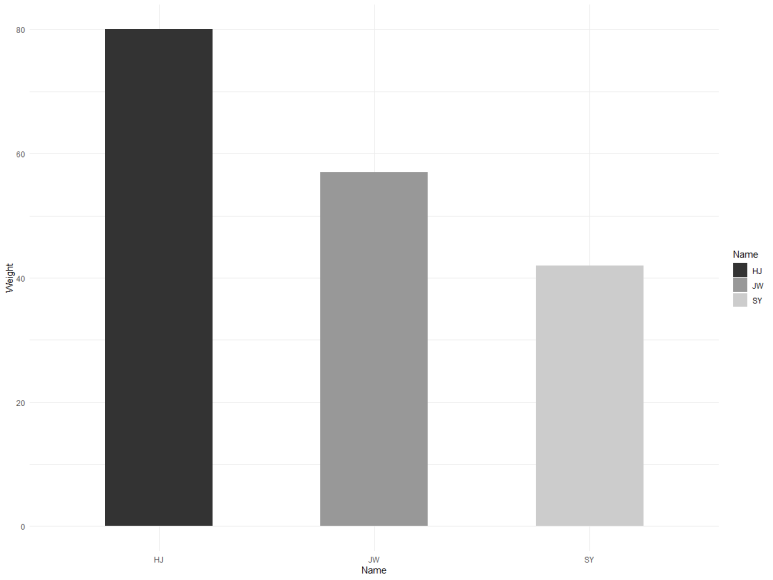
p<-ggplot(df, aes(x=Name, y=Weight, fill=Name)) + geom_bar(stat="identity", width=0.5)+theme_minimal()
p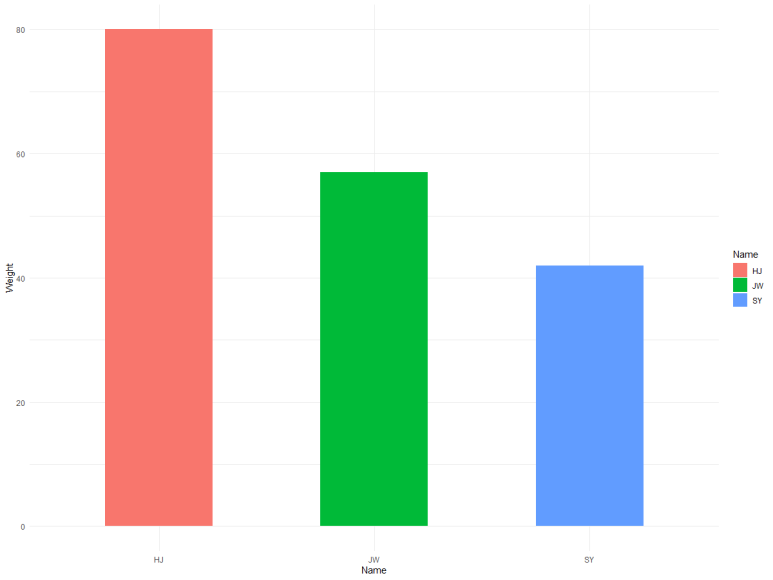
fill 인자에 group 변수를 넣어주시면 색깔은 마음대로 변경할 수 있습니다.
색깔을 사전에 정해줄 수도 있습니다.
아래에 3가지 방법을 추가해보았습니다.
# Use custom color palettes
p+scale_fill_manual(values=c("#999999", "#E69F00", "#56B4E9"))

# use brewer color palettes
p+scale_fill_brewer(palette="Dark2")

# Use grey scale
p + scale_fill_grey()
(7) 범주 위치 변경
p + theme(legend.position="top")
p + theme(legend.position="bottom")

# Remove legend
p + theme(legend.position="none")
theme 함수의 legend.position 인자에 위치를 넣어주시면, 해당 위치에 범주가 배치됩니다.
'데이터 다루기 > 데이터 시각화' 카테고리의 다른 글
| [R을 활용한 시각화] 4. ggplot2 (Box plot) (0) | 2020.11.30 |
|---|---|
| [R을 활용한 시각화] 3. ggplot2 (Scatter plot) (0) | 2020.11.30 |
| [R을 활용한 시각화] 2. ggplot2 (Lineplot) (0) | 2020.11.25 |
| [R을 활용한 시각화] 1. ggplot2 (Barplot) (2) (0) | 2020.11.25 |
| [R을 활용한 시각화] 1. ggplot2 (Barplot) (1) (0) | 2020.11.23 |


