728x90
반응형
이번 포스팅에서는 ggplot2 패키지를 활용해서 다양한 Barplot을 그려보도록 하겠습니다.
1. 실습 데이터 정의
df <- data.frame(dose=c("D1", "D2", "D3"),
                 len=c(4.2, 10, 29.5))
head(df)

<< Result >>
  dose  len
1   D1  4.2
2   D2 10.0
3   D3 29.5
우선 단순한 데이터를 정의 하였습니다.
2. 패키지 불러오기
library(ggplot2)library 함수를 통해 먼저 ggplot2 패키지를 불러왔습니다.
3. Linegraph 꾸미기
# Basic line plot with points
ggplot(data=df, aes(x=dose, y=len, group=1)) +
  geom_line()+
  geom_point() +
  geom_text(aes(label = len), vjust = -0.8, size = 5)
line graph는 geom_line 함수를 통해서 그릴 수 있습니다.
geom_point 함수는 line 뿐만 아니라, 관측치의 위치에 점을 찍어줍니다.
geom_text로 label 또한 추가할 수 있습니다.
(1) Line type
# Change the line type
ggplot(data=df, aes(x=dose, y=len, group=1)) +
  geom_line(linetype = "dashed", size = 2)+
  geom_point()
line type 인자를 활용해, 점선으로 바꿀수 있고, size 인자로 line의 두께를 조절할 수 있습니다.
(2) Line color
# Change the color
ggplot(data=df, aes(x=dose, y=len, group=1)) +
  geom_line(color="red", size = 3)+
  geom_point(size = 5)
Color 인자를 활용해, line의 색깔을 조절할 수 있습니다.
4. 선 그래프 여러개 그리기
(1) New data
df2 <- data.frame(supp=rep(c("VC", "OJ"), each=3),
                  dose=rep(c("D1", "D2", "D3"),2),
                  len=c(6.8, 15, 33, 4.2, 10, 29.5))

<< Result >>
  supp dose  len
1   VC   D1  6.8
2   VC   D2 15.0
3   VC   D3 33.0
4   OJ   D1  4.2
5   OJ   D2 10.0
6   OJ   D3 29.5
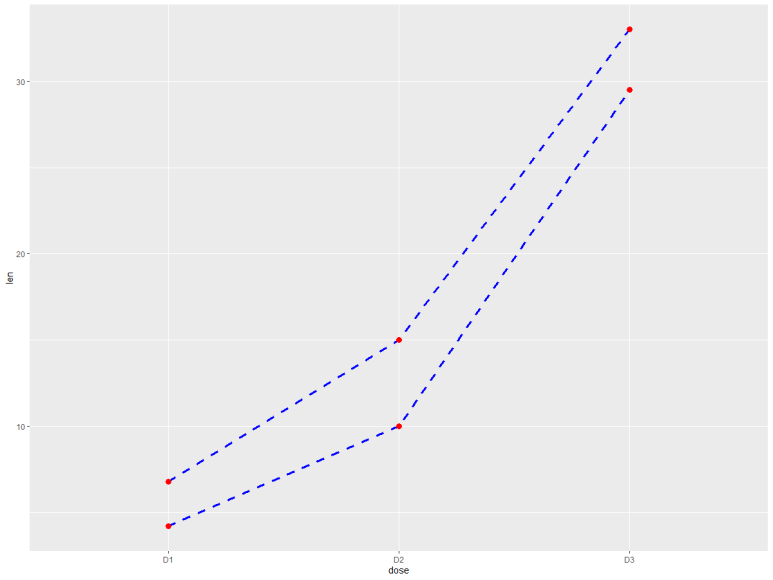
2개의 그룹을 가지는 새로운 데이터입니다.
(2) Multiple lines
# Change line types
ggplot(data=df2, aes(x=dose, y=len, group=supp)) +
  geom_line(linetype="dashed", color="blue", size=1.2)+
  geom_point(color="red", size=3)
group 인자에 나눠서 그리게 될 기준을 입력해주시면 됩니다.
# Change line colors by groups
p<-ggplot(df2, aes(x=dose, y=len, group=supp)) +
  geom_line(aes(color=supp), size = 3)+
  geom_point(aes(color=supp), size = 5)
p
group 별로 색깔을 다르게 지정할 수도 있습니다.
반응형
'데이터 다루기 > 데이터 시각화' 카테고리의 다른 글
| [R을 활용한 시각화] 4. ggplot2 (Box plot) (0) | 2020.11.30 |
|---|---|
| [R을 활용한 시각화] 3. ggplot2 (Scatter plot) (0) | 2020.11.30 |
| [R을 활용한 시각화] 1. ggplot2 (Barplot) (2) (0) | 2020.11.25 |
| [R을 활용한 시각화] 1. ggplot2 (Barplot) (1) (0) | 2020.11.23 |
| [R을 활용한 시각화] 1. ggplot2 (Barplot) (1) (1) | 2020.11.23 |


