이번 포스팅에서는 ggplot2 패키지를 활용해서 다양한 Vilolin plot을 그려보도록 하겠습니다.
1. 실습 데이터 정의
# Convert the variable dose from a numeric to a factor variable
ToothGrowth$dose <- as.factor(ToothGrowth$dose)
head(ToothGrowth)

<< Result >>
   len supp dose
1  4.2   VC  0.5
2 11.5   VC  0.5
3  7.3   VC  0.5
4  5.8   VC  0.5
5  6.4   VC  0.5
6 10.0   VC  0.5
오늘 사용할 데이터는 내장 데이터인 ToothGrowth입니다.
2. 패키지 불러오기
library(ggplot2)library 함수를 통해 먼저 ggplot2 패키지를 불러왔습니다.
3. Violin plot 꾸미기
p <- ggplot(ToothGrowth, aes(x=dose, y=len)) +
  geom_violin()
p
Vilolin plot은 geom_violin 함수를 통해 그릴 수 있습니다.
(1) 회전
# Rotate the violin plot
p + coord_flip()

coord_flip() 함수를 violin plot을 회전시켜 그릴 수 있습니다.
(2) Trim
# Set trim argument to FALSE
ggplot(ToothGrowth, aes(x=dose, y=len)) +
  geom_violin(trim=FALSE)
trim 인자는 default로 True로 되어있지만, False를 인자로 줌으로써, 끝 부분을 뾰족하게 만들 수 있습니다.
(3) Static point
# violin plot with median points
p + stat_summary(fun.y=median, geom="point", size=2, color="red")

stat_summary 함수를 통해, 그래프 내에 통계량을 찾아낼 수 있습니다.
위같은 경우는 y값의 Median 값을 point로 찍어주었습니다.
(4) Insert a box plot
# Add median and quartile
p + geom_boxplot(width=0.1)
그려진 violin plot에 box plot을 추가해주시면, 내부에 box plot이 추가가 됩니다.
(5) Jitter plot
# violin plot with jittered points
# 0.2 : degree of jitter in x direction
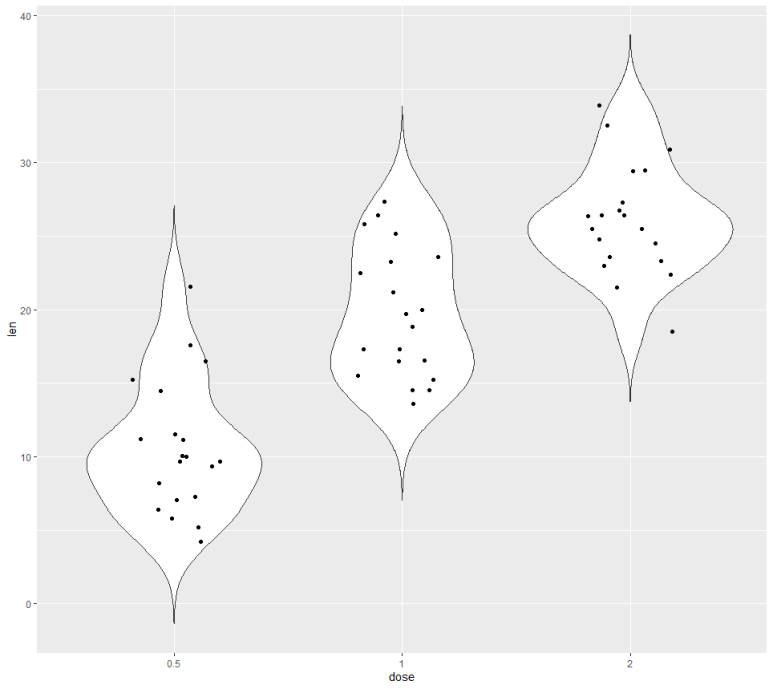
p + geom_jitter(shape=16, position=position_jitter(0.2))

geom_jitter 함수를 통해서, violin plot 내부에 점들을 찍을 수 있습니다.
(6) Violin plot color
# Change violin plot colors by groups
p<-ggplot(ToothGrowth, aes(x=dose, y=len, fill=dose)) +
  geom_violin(trim=FALSE)
p
fill 인자에 group 변수를 넣으면, violin plot의 색깔을 변경할 수 있습니다.
# Change violin plot colors by groups
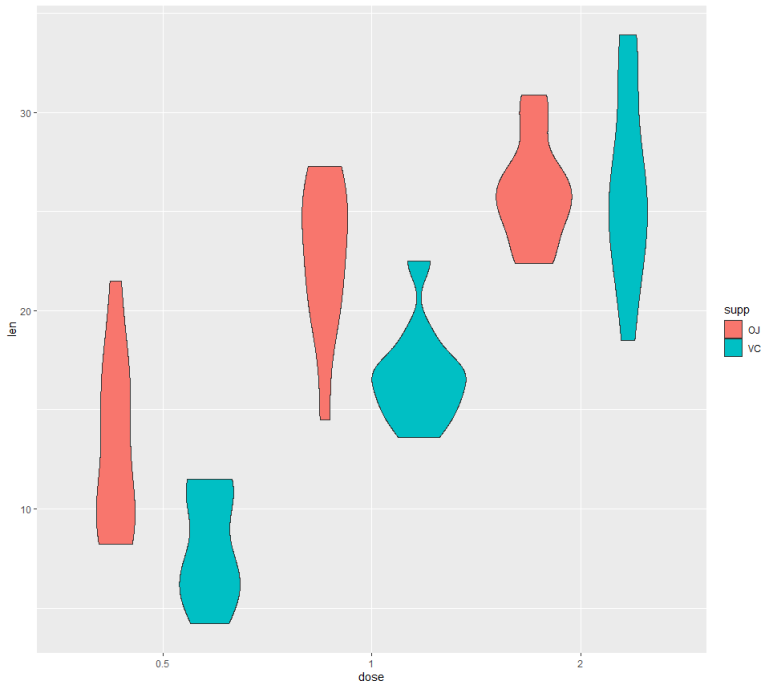
ggplot(ToothGrowth, aes(x=dose, y=len, fill=supp)) +
  geom_violin()
fill 인자에, 새로운 group 변수를 넣으면 그 그룹별로 violin plot이 그려집니다.
# Add dots
p + geom_jitter(shape=16,position=position_dodge(1))
'데이터 다루기 > 데이터 시각화' 카테고리의 다른 글
| [Python 시각화] Scatter plot (점 그래프) (0) | 2022.12.05 |
|---|---|
| [R을 활용한 시각화] 9. ggplot2 (ECDF: 경험적 누적 밀도 함수) (0) | 2020.12.11 |
| [R을 활용한 시각화] 7. ggplot2 (Histogram) (0) | 2020.12.10 |
| [R을 활용한 시각화] 6. ggplot2 (Pie Chart) (0) | 2020.12.04 |
| [R을 활용한 시각화] 5. ggplot2 (Area plot) (0) | 2020.12.04 |


